")

- USD/JPY rallies above 134.00 after breaking above the 200-day EMA.
- USD/JPY Price Analysis: Upward biased, though a daily close above the 200-DMA could cement the uptrend.
The USD/JPY rallies more than 100 pips and clears the 134.00 mark, breaking north of the 200-day Exponential Moving Average (EMA) at 133.77, a bullish/bearish bias measure for an asset. Hence, the USD/JPY shifted bullish during the session, though a daily close above the 200-day EMA would keep bulls hopeful for further upside. At the time of writing, the USD/JPY exchanges hand at 134.28 after hitting a low of 132.54.
From a daily chart perspective, the USD/JPY shifted upward biased after dropping from last year’s high of 151.94 towards the YTD low of 127.21 on January 16. Nevertheless, the USD/JPY needs to clear the confluence of the 100-day EMA and the YTD high at 134.77 to cement the uptrend.
USD/JPY 4-Hour chart
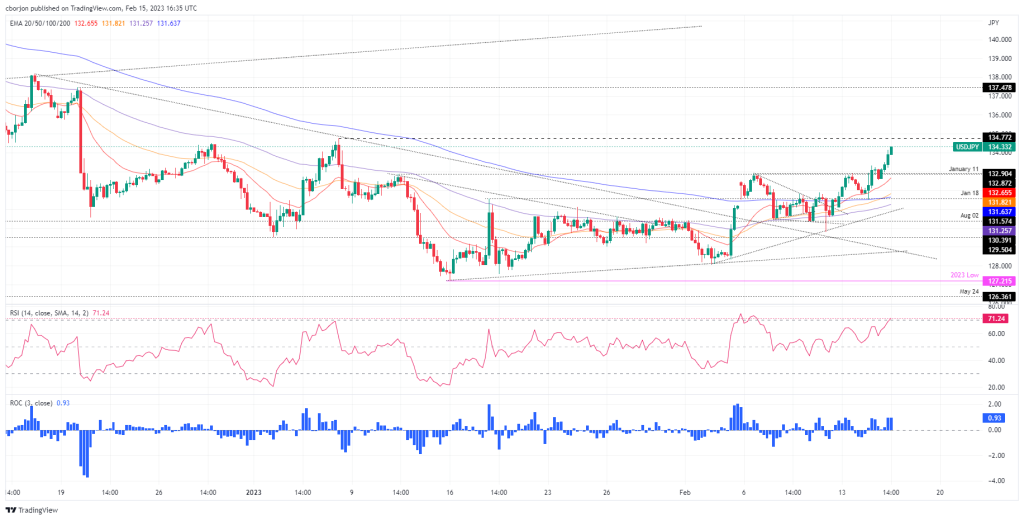
The Relative Strength Index (RSI) and the Rate of Change (RoC) show that buyers are gathering momentum. Hence, the USD/JPY might test the 135.00 psychological level in the near term.
The USD/JPY 4-hour chart depicts the pair as bullish biased after breaking from the 131.70-133.00 consolidation range, eyeing to test the YTD high at 134.77. Even though the RSI shifted overbought, as long as it stays below 80, it portrays the USD/JPY in a strong uptrend. The RoC shows buyers are in control and might continue to ride the trend.
Therefore, the USD/JPY first resistance would be the YTD high at 134.77. A breach of the latter and the pair might get to 135.00, followed by 136.00, and then the December 19 daily high of 137.47.
USD/JPY Key technical levels
USD/JPY
| OVERVIEW | |
|---|---|
| Today last price | 134.21 |
| Today Daily Change | 1.17 |
| Today Daily Change % | 0.88 |
| Today daily open | 133.04 |
| TRENDS | |
|---|---|
| Daily SMA20 | 130.51 |
| Daily SMA50 | 132.1 |
| Daily SMA100 | 137.96 |
| Daily SMA200 | 136.85 |
| LEVELS | |
|---|---|
| Previous Daily High | 133.32 |
| Previous Daily Low | 131.5 |
| Previous Weekly High | 132.91 |
| Previous Weekly Low | 129.81 |
| Previous Monthly High | 134.78 |
| Previous Monthly Low | 127.22 |
| Daily Fibonacci 38.2% | 132.62 |
| Daily Fibonacci 61.8% | 132.19 |
| Daily Pivot Point S1 | 131.92 |
| Daily Pivot Point S2 | 130.8 |
| Daily Pivot Point S3 | 130.11 |
| Daily Pivot Point R1 | 133.74 |
| Daily Pivot Point R2 | 134.43 |
| Daily Pivot Point R3 | 135.55 |