- USD/CAD picks up bids to refresh intraday high, prints the first daily gains in four.
- Bearish MACD signals, “double top” formation keeps Loonie pair sellers hopeful.
- Multiple hurdles to challenge buyers, 1.3800 is the key upside hurdle.
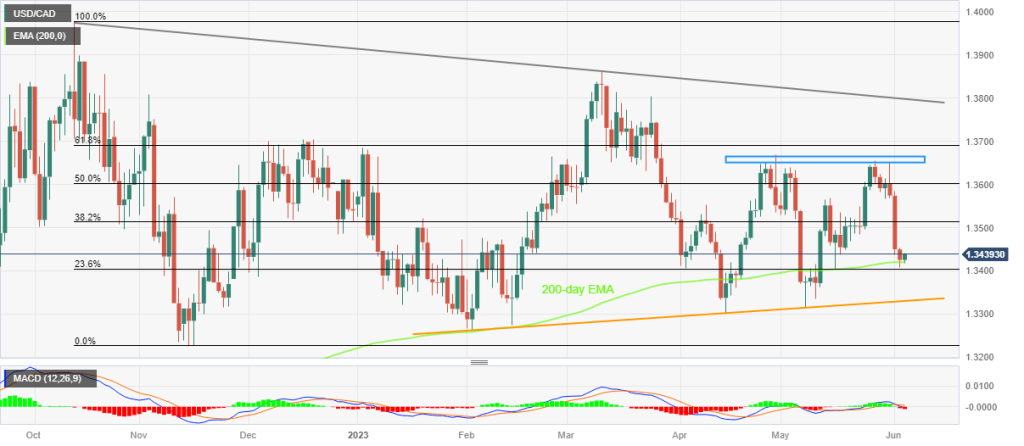
USD/CAD recovers from the key Exponential Moving Average (EMA) while snapping a three-day downtrend near 1.3440 heading into Monday’s European session. In doing so, the Loonie pair renews its intraday high while bouncing off the lowest levels in three weeks.
It’s worth noting that the quote’s recovery fails to justify bearish MACD signals and hence suggests limited upside room.
Even so, the USD/CAD pair’s rebound from the 200-EMA, around 1.3420 by the press time, allows the Loonie bears to aim for the 1.3500 threshold.
Following that, the 50% Fibonacci retracement level of the pair’s October-November 2022 downside, near 1.3600, can’t be ruled out.
However, a “double top” bearish chart pattern, with highs surrounding 1.3650-65, appears a tough nut to crack for the USD/CAD bulls.
Even if the Loonie pair defies the bearish formation by crossing the 1.3665 hurdle, a downward-sloping resistance line from late October 2022, close to 1.3800 by the press time, can challenge the pair buyers before giving them control.
Alternatively, a daily closing below the 200-EMA level of around 1.3420 could quickly drag the USD/CAD price towards a four-month-old upward-sloping support line, near 1.3330, a break of which will refresh the yearly low, currently around 1.3260.
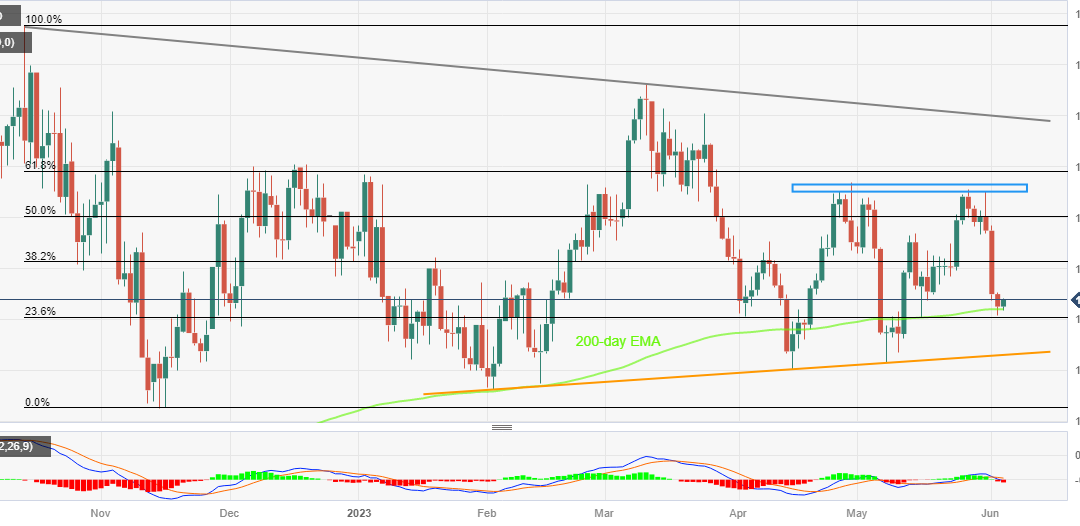
USD/CAD: Daily chart

Trend: Limited recovery expected
ADDITIONAL IMPORTANT LEVELS
| OVERVIEW | |
|---|---|
| Today last price | 1.3439 |
| Today Daily Change | 0.0014 |
| Today Daily Change % | 0.10% |
| Today daily open | 1.3425 |
| TRENDS | |
|---|---|
| Daily SMA20 | 1.3505 |
| Daily SMA50 | 1.3507 |
| Daily SMA100 | 1.3518 |
| Daily SMA200 | 1.3507 |
| LEVELS | |
|---|---|
| Previous Daily High | 1.3452 |
| Previous Daily Low | 1.3407 |
| Previous Weekly High | 1.3651 |
| Previous Weekly Low | 1.3407 |
| Previous Monthly High | 1.3655 |
| Previous Monthly Low | 1.3315 |
| Daily Fibonacci 38.2% | 1.3424 |
| Daily Fibonacci 61.8% | 1.3435 |
| Daily Pivot Point S1 | 1.3404 |
| Daily Pivot Point S2 | 1.3383 |
| Daily Pivot Point S3 | 1.3358 |
| Daily Pivot Point R1 | 1.345 |
| Daily Pivot Point R2 | 1.3474 |
| Daily Pivot Point R3 | 1.3495 |

