")

- EUR/USD regains traction after bottoming out near 1.0860.
- Further recovery should initially target the mid-1.0900s.
EUR/USD reverses four consecutive sessions of losses and regains the area beyond 1.0900 the figure on Thursday.
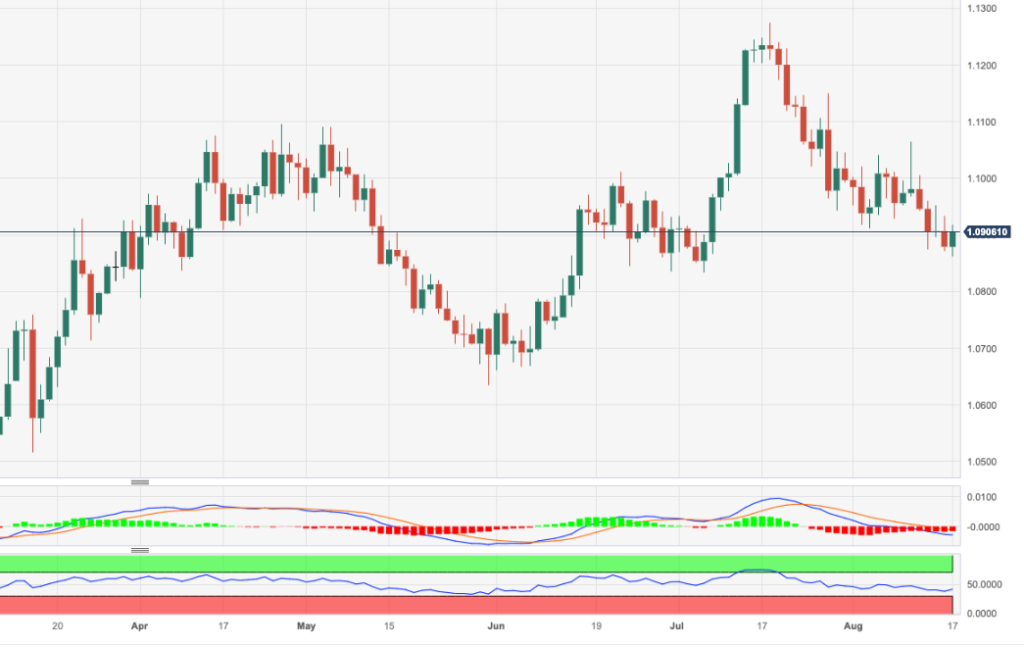
If the rebound gathers extra steam, it could encourage the pair to dispute the interim 55-day SMA at 1.0951 prior to the weekly peak at 1.1065 (August 10). Further north from here comes the weekly high of 1.1149 (July 27). Once this region is cleared, the pair’s downside pressure is expected to mitigate.
Looking at the longer run, the positive view remains unchanged while above the 200-day SMA, today at 1.0787.
EUR/USD daily chart
EUR/USD
| OVERVIEW | |
|---|---|
| Today last price | 1.091 |
| Today Daily Change | 57 |
| Today Daily Change % | 0.28 |
| Today daily open | 1.0879 |
| TRENDS | |
|---|---|
| Daily SMA20 | 1.0994 |
| Daily SMA50 | 1.0973 |
| Daily SMA100 | 1.0931 |
| Daily SMA200 | 1.0785 |
| LEVELS | |
|---|---|
| Previous Daily High | 1.0934 |
| Previous Daily Low | 1.0872 |
| Previous Weekly High | 1.1065 |
| Previous Weekly Low | 1.0929 |
| Previous Monthly High | 1.1276 |
| Previous Monthly Low | 1.0834 |
| Daily Fibonacci 38.2% | 1.0896 |
| Daily Fibonacci 61.8% | 1.091 |
| Daily Pivot Point S1 | 1.0856 |
| Daily Pivot Point S2 | 1.0832 |
| Daily Pivot Point S3 | 1.0793 |
| Daily Pivot Point R1 | 1.0919 |
| Daily Pivot Point R2 | 1.0958 |
| Daily Pivot Point R3 | 1.0982 |